Data Visualization projects with JavaScript


scatterplot
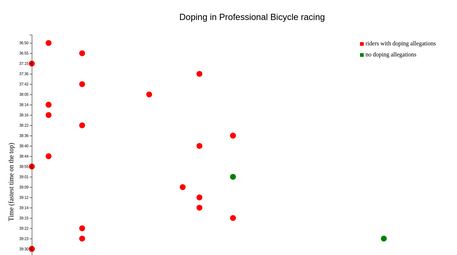
FCC Project - Scatter plot with D3.js

This project is part of freeCodeCamp curriculum. It is built using D3.js (a javascript library for data visualization). This scatter plot shows doping in professional cycling.

barplot
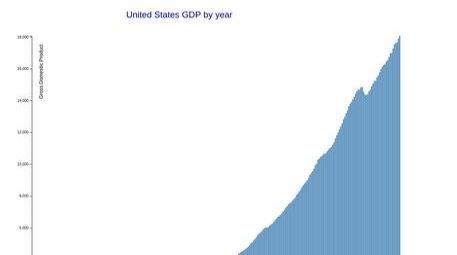
FCC Project - Bar chart with D3.js

This project is part of freeCodeCamp curriculum. It is built using D3.js. This bar plot shows United States GDP by year.

stacked_bar_chart
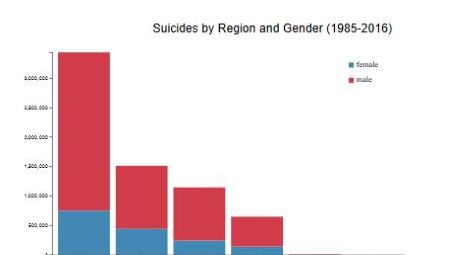
Stacked Bar chart with D3.js

This chart is built using D3.js. This visualizes suicides for the years 1985-2016 by region among male and female.

heat_map
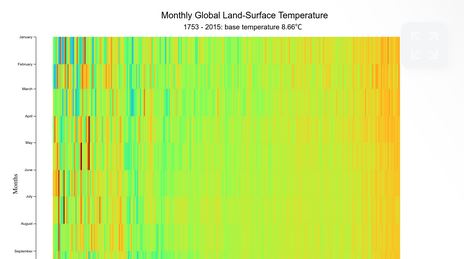
FCC Project - Heat Map with D3.js

This chart is built using D3.js. This visualizes changes in global temperatures over the years from 1753-2015.

choropleth_map
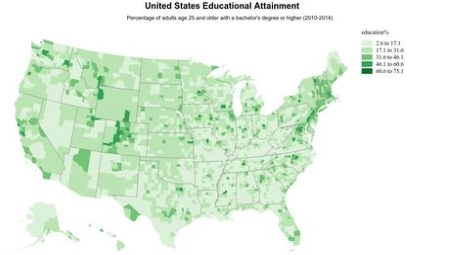
FCC Project - Choropleth Map with D3.js

This chart is built with D3.js. This map visualizes adults in United States aged 25 or more with Bachelor's degree or higher from 2010-2014.


airqualityplot
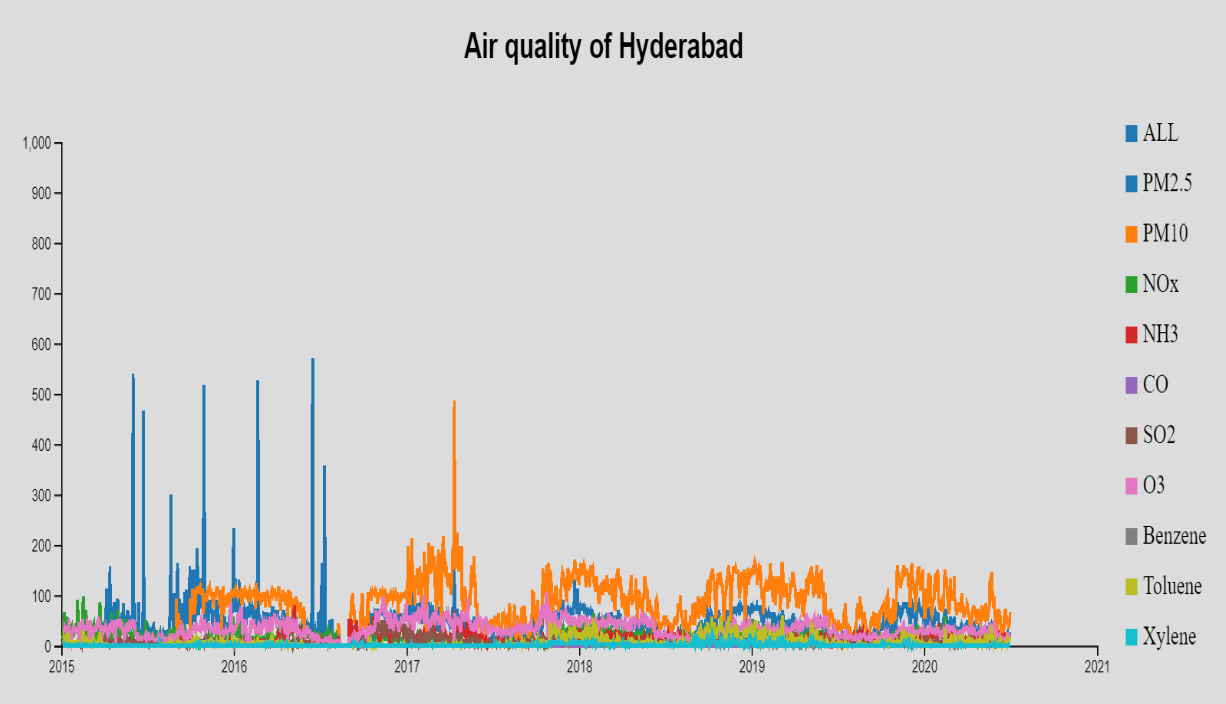
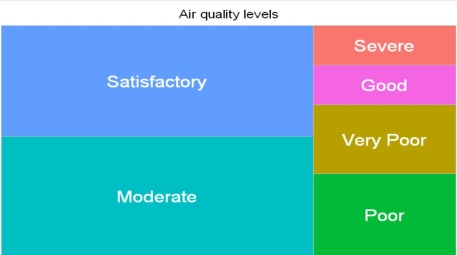
Air Quality in Indian Cities with D3.js

This project analyzes air quality in indian cities for the period 2015-2020 using D3.js.

StreamGraph
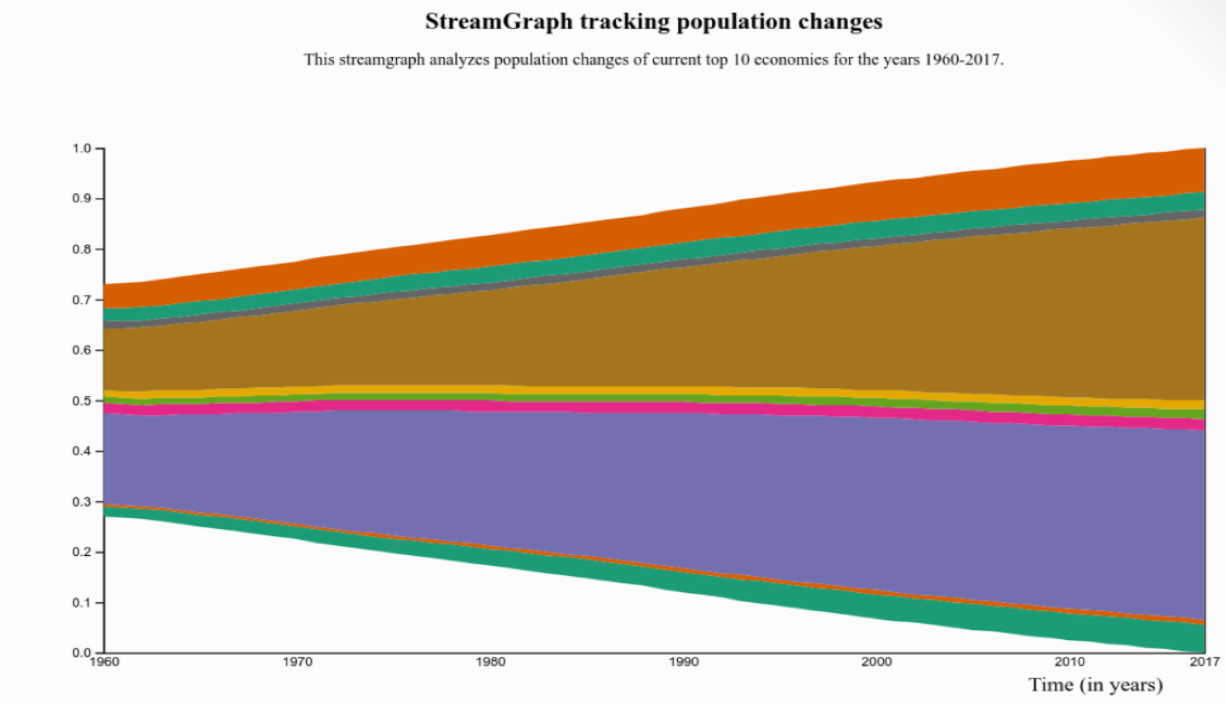
Stream Graph with D3.js

This project tracks population changes of Top 10 economies for the period 1960-2017 using D3.js.

Sortable_Bar_Chart
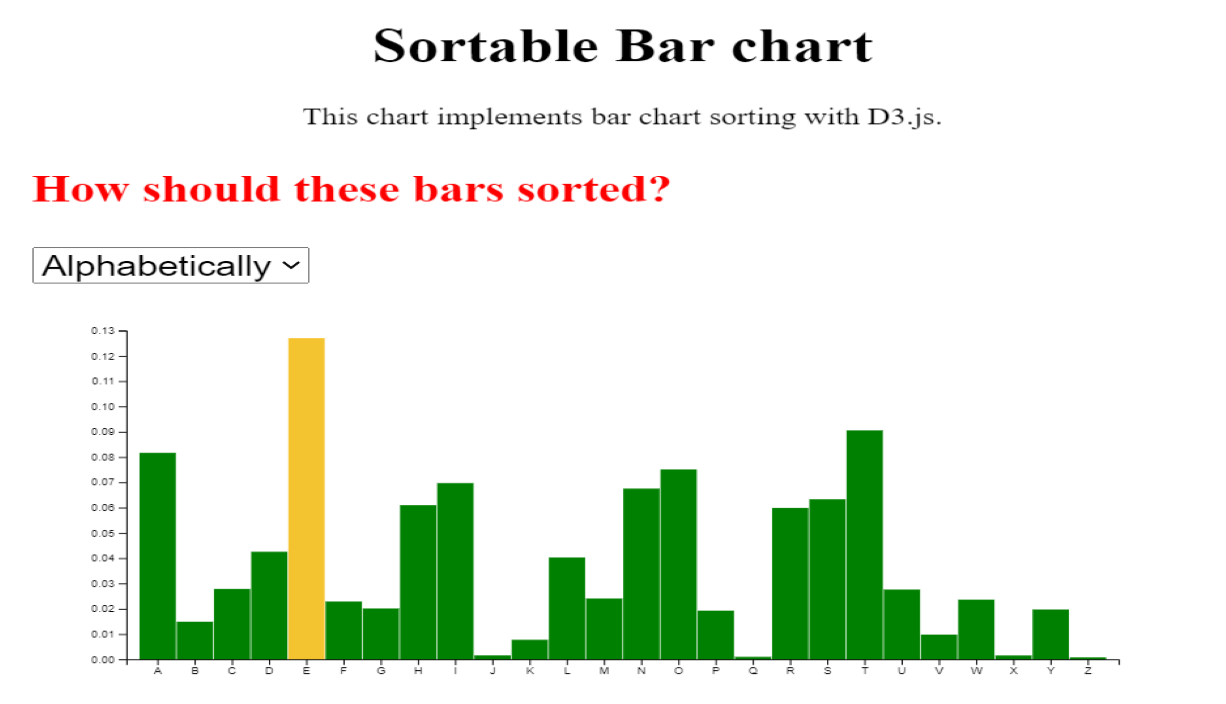
Sortable Bar Chart with D3.js

This project shows how bar chart is sorted using D3.js.
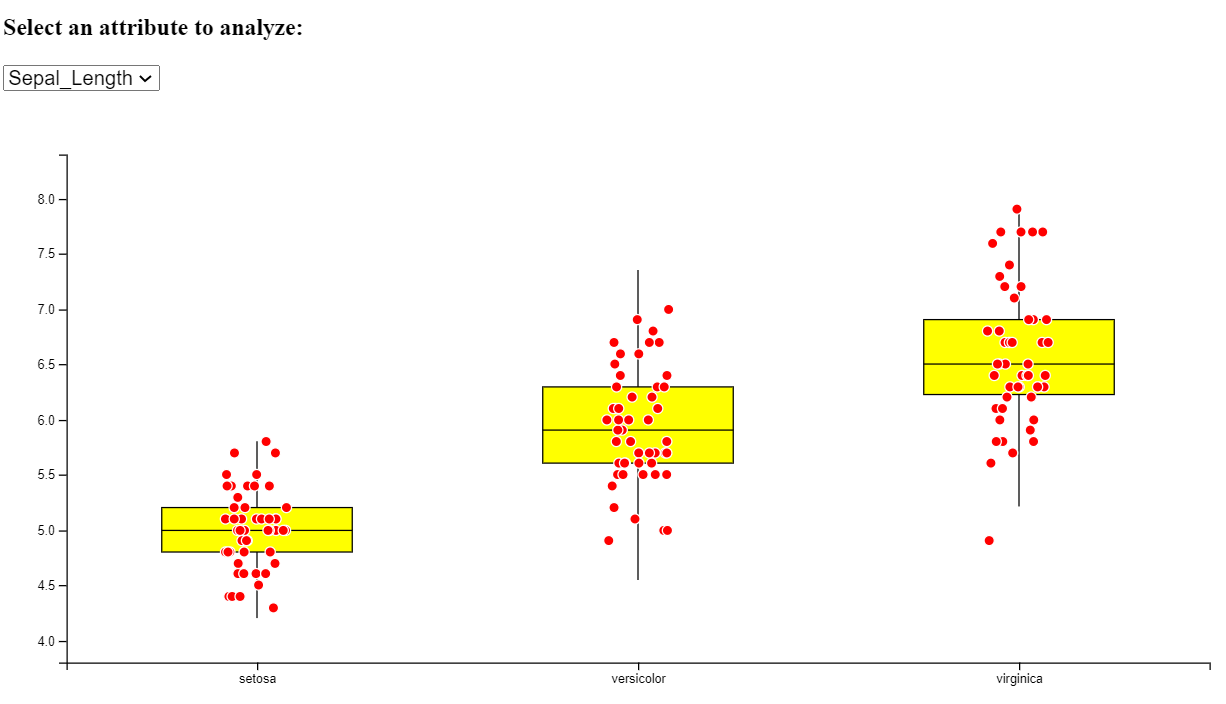
Box_Plot
Box plot with D3.js

This project analyzes Iris dataset with box plot using D3.js.

Data Science projects


WorldHappiness
Exploring World Happiness data

Which countries or regions rank the highest in overall happiness and each of the six factors contributing to happiness?

RoadSafety
Exploring UK-Road Safety data

Set up 20 digital advertising boards with some key attributes to road safety at areas with most impact.

HRLeavers
Exploring HR Leavers dataset

Understand the reasons behind employee attrition.

pima-indian-diabetes
Exploring Pima Indian Diabetes dataset

Based on diagnostic measurements, predict whether a patient has diabetes.

pollution-in-indian-cities
Air Quality in Indian Cities 2015-2020

Based on the pollutant measurements collected from 2015 to 2020, analyzing air quality in Indian cities.

Web Development projects


TributePage
FCC Project - A Tribute Page

This project is part of freeCodeCamp curriculum. It is tribute page on Gertrude Ellion who is a Nobel prize winner in Medicine in 1988.

TechnicalDocumentation
FCC Project - A Technical Documentation Page

This project is part of freeCodeCamp curriculum. It has part of technical documentation of Scala.

ProductPage
FCC-A Product Landing Page

This project is part of freeCodeCamp curriculum. A product landing page of a fictitious company.

SurveyForm
FCC - A Survey Form Template

This project is part of freeCodeCamp curriculum. A survey form template.